

Power BI
Power BI turns the data scattered across your business into live, accurate dashboards that update automatically and work on any device. The numbers are in here somewhere. Let's make 'somewhere' easier to find.
Why Power BI
Turn agreed measures into decisions
Power BI can bring operational and financial data into reports, dashboards, and semantic models that teams use together. The hard part is agreeing on definitions, ownership, refresh behavior, security, and the licensing path before building a report people cannot trust.
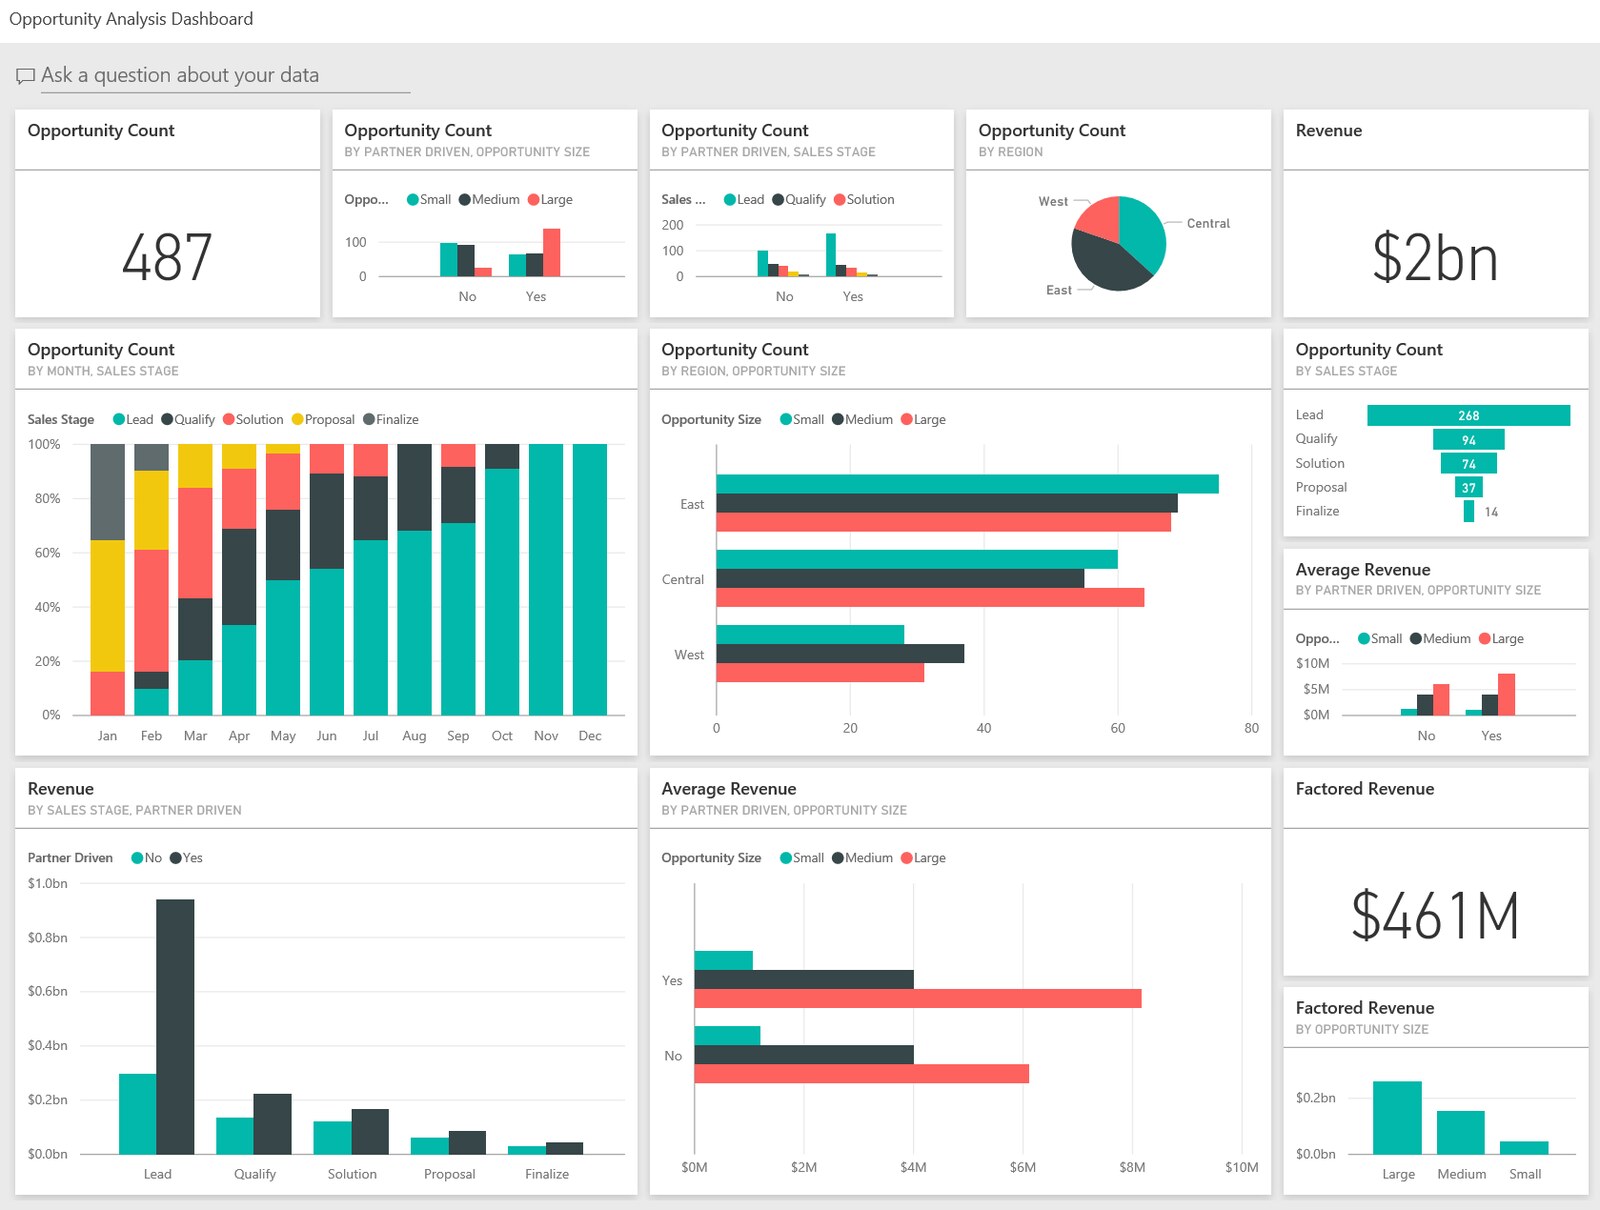
What you can do with Power BI
Live dashboards and reports
Data updates automatically across web, mobile, and embedded visuals, so nobody is working from a stale export.
AI-powered insights (Copilot)
Ask a question in plain language and Power BI turns it into a chart.
Broad integration
Connects to Excel, SQL, Dataverse, Teams, and hundreds of other sources without custom middleware.
Flexible licensing
Scales from a small team to the full company without a sudden jump in cost.
Sound familiar?
When Power BI is worth a closer look
Start with the work that needs to change. These are useful reasons to assess the fit.
- Leaders and teams need a shared view of measures that are currently reconciled across spreadsheets or systems.
- Source systems, business definitions, refresh timing, and data ownership can be made explicit and tested.
- The organization can choose a workspace, sharing, row level security, gateway, and capacity approach that matches the audience.
What changes for your team
| Pain point | The fix | The result |
|---|---|---|
| Reports are outdated before anyone opens them | Live dashboards with auto-refresh | Real-time clarity without extra manual work |
| Insights get lost in scattered spreadsheets | A unified data model with clear visuals | Data people actually pay attention to |
| Reports only analysts know how to build or use | AI-driven chat and storytelling through Copilot | Everyone gets instant answers, not just analysts |
| Enterprise-grade BI costs too much to justify | Scalable licensing and built-in governance | Real insight without a big spend |
Power BI with TruNova
The partner behind the implementation
TruNova aligns measures and source ownership, builds semantic models and reports, configures refresh and security, and helps teams use the resulting information in the decisions that matter.
Separate software from services
Software pricing and implementation costs
Pro and Premium Per User are per user subscriptions. Users collaborating in a Premium Per User workspace generally need that license. Fabric capacity is purchased separately. Free users can view shared Power BI content on qualifying F64 or larger capacity; publishing and other access scenarios have separate licensing requirements.
| Plan or option | Published US price | Billing and scope |
|---|---|---|
| Power BI Free account | $0.00 | per user; free Power BI account |
| Power BI Pro | $14.00 | per user/month, paid yearly |
| Power BI Premium Per User | $24.00 | per user/month, paid yearly |
US pricing checked September 7, 2026. Power BI pricing Power BI licensing for organizations Power BI data sources Microsoft Fabric pricing Prices, availability, taxes, and regional terms may vary.
What changes the implementation budget?
- The number of semantic models, tables, relationships, measures, data volumes, refresh patterns, and incremental refresh rules affects modeling, validation, and future maintenance.
- Source quality, import or DirectQuery choices, on premises gateways, credentials, refresh timing, query performance, and reconciliation with the source system determine the reporting work.
- Workspace design, deployment stages, row level security, audience size, external sharing, tenant policies, and the choice between per user licensing and Fabric capacity shape the operating model.
Software fees do not include TruNova implementation services. Our estimate tool provides an initial planning range. We confirm scope, dependencies, and pricing during discovery.
Works with your wider business
Keep the tools. Connect the work.
Microsoft Dataverse
Power BI can connect to Dataverse tables for reporting and analysis. Confirm the environment, table permissions, data model, refresh mode, and row level security before treating the report as an operational source.
Microsoft Fabric workloads
Power BI semantic models and reports can run alongside Fabric data engineering, warehousing, and real time workloads. Confirm workspace placement, capacity SKU, CU utilization, publishing rights, and whether viewers need Pro or can use the F64 rule.
Power Automate
Power Automate can respond to supported Power BI events and help coordinate refresh or notification steps. Confirm workspace permissions, source and gateway timing, connector behavior, and the owner who will review failures.
Where this shows up
Industries that use this most: Healthcare and life sciences, Manufacturing, Nonprofits, Professional services, Retail and e-commerce.
Questions about Power BI
Before you decide
Do report viewers need Power BI Pro?
The answer depends on where the content is stored and the user’s activity. Pro or Premium Per User is generally needed to publish, edit, share, or collaborate. Free viewers can consume shared Power BI content hosted on Fabric F64 or larger capacity when Microsoft’s licensing and workspace rules are met. On smaller capacity, viewers generally need Pro or PPU.
Should we choose Power BI Pro, Premium Per User, or Fabric capacity?
Pro is the usual per user collaboration path. Premium Per User adds premium features per user, and users sharing content in a PPU workspace generally need PPU. Fabric capacity provides a shared compute pool for Power BI and other Fabric workloads, with a CU based Azure charge and separate user licensing requirements for some activities. Compare the audience, model needs, workload mix, publishing, and governance before choosing.
What affects Power BI implementation effort?
Semantic model design, source quality, measure definitions, refresh and gateway setup, performance, row level security, workspace and deployment structure, and the number of audiences all affect the work. A report can be assembled quickly while a trusted reporting model needs clear ownership and testing.
Work with TruNova
Where are you starting?
Start
Outgrown the tools you have? Let us plan the next system around your team.
Optimize
Already using the tools? Let us help with the steps that still take too much work.
Rescue
In the middle of an implementation that is going wrong? Bring us what is stuck.
Support and ongoing education for your system and your team.
Already using Power BI? The $4,000 System optimization review covers one application over two weeks, with up to five priority pain points and a report with cost estimates. Implementation of recommendations is a separate project.

What could your project cost?
Wondering what it would take? Tell the estimate tool a little about your team and your systems for an initial planning range. We can talk through the details together.
A starting point for planning. We confirm scope and pricing during discovery.